Some Basic from 19 October 2018

Look at the Original Post at https://weathercharts.wordpress.com/2018/10/20/19-october-2018/

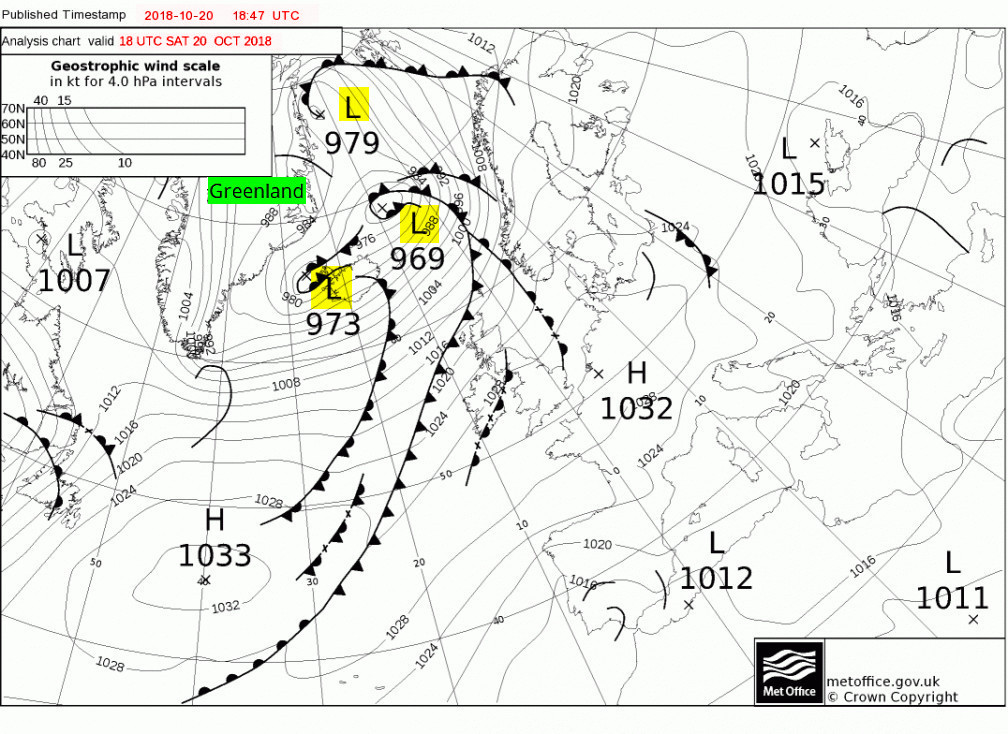
18:00 on the 20th Note the three cyclones on the east of Greenland and the breaking cold front of an occlusion….

24

Followed by the sudden appearance of the huge unnatural Anticyclone. OK, maybe not that huge but it isn’t the minuscule dotted series it should be, either.

Follow these North Americanos for when the large earthquake heralds th eruption because…

2018102000_024

Three adjacent Lows show that the eruption will be running from this date.

2018102000_072

After the large eruption that is.

2018102000_096

What am I talking about the three Anticyclone I mean, do I?

2018102000_120

It is all very odd are we to expect another magnitude 7+ or some such?

2018102000_144

I think the NAEFS is being stifled from giving us the correction due to the Canadians trying to hide an Huchison Effect as a Butterfly Effect

Get that out right now!!

The next big one is on the NAEFS for 5 days time, the 16th:

Ergo it is on the t+120 of the North Atlantic too:

No it is on the board but that is the wrong day

Tonight first, a forecast clears the butterfly effect from the models before we see the next one clearly enough. Odd how that works!
https://earth.nullschool.net/#current/wind/surface/level/orthographic=-26.50,52.98,289

Wow!
Watch this:

54 words


Keep On The Watch! – Daily Table: 20180928

What quakes happened before the last Atlantic storms?

Date Time Region Mg Atlantic Storm 2018 Status
2018-09-28   13:35:30.3 MINAHASA, SULAWESI, INDONESIA 5.7
2018-09-28   12:32:45.0 MARTINIQUE REGION, WINDWARD ISL. 5.5
2018-09-28   10:50:24.8 5.7
2018-09-28   10:25:04.2 5.8
2018-09-28   10:16:48.6 5.7
2018-09-28   10:14:20.0 5.8
2018-09-28   10:02:44.3
7.4
2018-09-28   07:00:02.1 MINAHASA, SULAWESI, INDONESIA 6.1
Leslie Tropical Rainstorm
Kirk Tropical Storm


Data taken from:

This morning’s charts . ago 22, 2018

Charts for North Atlantic from midnight 20… Whenever and the most recent update after the Venezuelan earthquake – Showing the Butterfly effect imposed on the weather by Geo-physical forces

Bit long for a title.

What are the last ones? The updates, right?
   This morning’s charts
They should be quite different from the 36hour
Can you run them side by side or something?
There you have them above…
For comparison to…

❀  
Published Timestamp 2018-08-21 16:37 UTC
Forecast chart (T+36) valid 00 UTC THU 23 AGO 2018

Esta es la carta metereológca relacionada con el temblor en Venezuela, mag 7.1 (martes 21 de agosto de 2018, 5:30 pm)
______
28 words

Distinguishing areas in the chart..


   Northern Canada is on the left with the all important island of Newfoundland prominent

The Nid Atlantic Ridge runs south of Iceland just right of Greenland, Norway is the Atlantic Approaches the centre of Submarine activity in WW2.

Britain is smack in the central the line from the NPole running down to Spain and the Mediteranian.

All the cyclone from North America generally leave Newfoundland by passing Greenland on there way to the North Atlantic. There is a wide Straight called the Davies Straight (Davis Strait / US) between Northern Canada and Greenland.

This fills with ice every winter and all the Icebergs from the Arctic come through there.

They were the ones that took out the Titanic.

So the weat is always some 5 degrees colder than the East giving us Maritime climate and them Sub Arctic climate.

The balance make sure we get the storms that used to power all the Sailing boats in the 19th Century.

There is usually a huge not very low pressure Cyclone over the bay that sometime goes to Clarence’s House in North America where he gets all those photos from. He is quite far inland over the centre, south of Hudson Bay.

This last stuff will have changed dramatically by now.

But I will do the latest run for you in a minute or so.

120 is 5 days wich isw all they like to give a forecast for.

It maintains accuracy quite well except that small changes refract what they like to call the Butterfly Effect = the changes caused by the geo-physics of the planet.

This is exactly the same energy value that Einstein considers the change caused by gravity.

In other words it is the “gravity well” that causes all the perturbations that Star Trek is based on, what they use to dispute the Celestial Navigation proposed by Newton.

In other words all the weather of the planets from Mars to Jupiter is the balance of the centre of the Solar System and what causes stars to shine.

Stars are probably quite cold in their centres all the heat from them comes off the surface in Solar flares. it probably freezes them.

When the star shine reaches the other stars balance is restored so the Universe is a zero gain sum.

None of it is missing as it calls to tell god everything is OK.

When the star shine reaches the other stars, balance is restored.

This messing around with the New Day must be very upsetting for Jehovah’s Woman.
———
416 worthy words

Put that on Qle

Esta es la carta metereológca relacionada con el temblor en Venezuela, mag 7.1 (martes 21 de agosto de 2018, 5:30 pm)

Lots of earthquakes signal their passage by running between to Highs like this

One in the top next to Greenland and one over Germany.

Cold weather coming, I think
Lots of earthquakes signal
I meant to say tornadoes
Lots of tornadoes signal
The weather is not a factor according to them. We know better and it always changes after a large quake.
 There was a nonstop rain after the EQ.

The rain is a tell

 “It was a hard rain, a perpetual rain, a sweating and steaming rain; it was a mizzle, a downpour, a fountain, a whipping in the eyes, an undertow at the ankles; it was a rain to drown all rains and the memory of rains.”
“The Long Rain” (1950)
Author Ray Bradbury
Original title “Death-by-Rain”
145 words